Volume Breaker Blocks [UAlgo]The "Volume Breaker Blocks " indicator is designed to identify breaker blocks in the market based on volume and price action. It is a concept that emerges when an order block fails, leading to a change in market structure. It signifies a pivotal point where the market shifts direction, offering traders opportunities to enter trades based on anticipated trend continuation.
🔶 Key Features
Identifying Breaker Blocks: The indicator identifies breaker blocks by detecting pivot points in price action and corresponding volume spikes.
Breaker Block Sensitivity: Traders can adjust breaker block detection sensitivity, length to be used to find pivot points.
Mitigation Method (Close or Wick): Traders can choose between "Close" and "Wick" as the mitigation method. This choice determines whether the indicator considers closing prices or wicks in identifying breaker blocks. Selecting "Close" implies that breaker blocks will be considered broken when the closing price violates the block, while selecting "Wick" implies that the wick of the candle must violate the block for it to be considered broken.
Show Last X Breaker Blocks: Users can specify how many of the most recent breaker blocks to display on the chart.
Visualization: Volume breaker blocks are visually represented on the chart with customizable colors and text labels, allowing for easy interpretation of market conditions. Each breaker block is accompanied by informational text, including whether it's bullish or bearish and the corresponding volume, aiding traders in understanding the significance of each block.
🔶 Disclaimer
Educational Purpose: The "Volume Breaker Blocks " indicator is provided for educational and informational purposes only. It does not constitute financial advice or a recommendation to engage in trading activities.
Risk of Loss: Trading in financial markets involves inherent risks, including the risk of loss of capital. Users should carefully consider their financial situation, risk tolerance, and investment objectives before engaging in trading activities.
Accuracy Not Guaranteed: While the indicator aims to identify potential reversal points in the market, its accuracy and effectiveness may vary. Users should conduct thorough testing and analysis before relying solely on the indicator for trading decisions.
Past Performance: Past performance is not indicative of future results. Historical data and backtesting results may not accurately reflect actual market conditions or future performance.
"pivot points"に関するスクリプトを検索

Liquidity Trendline With Signals [BigBeluga]The Liquidity Trendline is an indicator designed to identify potential breakouts by utilizing pivot points. These pivotal moments can trigger significant market reactions, either by breaking out or by serving as breakout and retest signals.
🔶 FEATURES
The indicator contains the following features:
Period of the calculation
Padding (spacing between the 2 lines)
Signal for breakouts
🔶 USAGE
As shown in the example, breakouts can be powerful points to see reversions in the market and can lead to a lot of volatility in the market.
When a trendline is broken, a signal will be plotted; the user can disable/enable those signals.
A trendline is formed when 2 consecutive pivot points are found, each of them lower or higher than the previous one. this is the anchor point for our trend line that we will use to spot rejection or breakouts
The delay in the creation of those trend lines will be the period input used to find the pivot point on the chart.
Another good example is using these trendlines as simple retests.
Prices bouncing on top of them will suggest a possible continuation of the current trend.
We can filter out stronger breakouts by looking at how many times the price has rejected the trendline, more rejections will result in more liquidity once the price breaks it.
Signals are plotted on the chart for every breakout that happens.
Another good utility is simply using them as retest once the price breaks those levels and holding above/below them, indicating a possible support or resistance area used for confluence
Here is another good example of how we can correctly spot price deviating from our trendline and spotting powerful continuation in price.
As said before we can filter out bad and good breakouts simply by looking at how many times rejected from those levels.
More rejection will result in a stronger reaction
🔶 CONCLUSION
This script is as simple as that and can be used in a few ways to spot reversals, price continuation, or even sentiment in price (bullish or bearish).

Relative Strength Scoring SystemRelative Strength Scoring System :
Important prerequisite :
This indicator can be loaded on any forex chart, i.e. a currency pair, but must not be loaded on any other asset due to certain market closures.
The chart timeframe must be less than or equal to the trading timeframe, which is the indicator's first parameter. A timeframe equal to that of the "Trading Timeframe" parameter is preferable.
Introduction :
This indicator measures the relative strength of a currency against all other currencies using spread formulas. It gives an indication of which currencies are bullish, neutral or bearish. The ultimate aim of this indicator is to find out which pair will generate a higher probability of gain than the others by pairing the most bullish pair with the most bearish pair.
Spread formulas :
To find the relative strength of a currency compared with others, we use the following spreads formulas :
USD = (FX:USDJPY/100+SAXO:USDEUR+FX:USDCHF+SAXO:USDGBP+FX:USDCAD+SAXO:USDAUD+FX_IDC:USDNZD)/7
JPY = (SAXO:JPYUSD/100+FX_IDC:JPYAUD/100+FX_IDC:JPYCAD/100+FX_IDC:JPYNZD/100+FX_IDC:JPYCHF/100+SAXO:JPYEUR/100+FX_IDC:JPYGBP/100)/7
CHF = (FX:CHFJPY/100+SAXO:CHFUSD+SAXO:CHFEUR+FX_IDC:CHFGBP+FX_IDC:CHFCAD+SAXO:CHFAUD+FX_IDC:CHFNZD)/7
EUR = (FX:EURJPY/100+FX:EURUSD+FX:EURCHF+FX:EURGBP+FX:EURCAD+FX:EURAUD+FX:EURNZD)/7
GBP = (FX:GBPJPY/100+FX:GBPUSD+FX:GBPCHF+SAXO:GBPEUR+FX:GBPCAD+FX:GBPAUD+FX:GBPNZD)/7
CAD = (FX:CADJPY/100+SAXO:CADUSD+FX:CADCHF+FX_IDC:CADGBP+SAXO:CADEUR+FX_IDC:CADAUD+FX_IDC:CADNZD)/7
AUD = (FX:AUDJPY/100+FX:AUDUSD+FX:AUDCHF+SAXO:AUDGBP+FX:AUDCAD+SAXO:AUDEUR+FX:AUDNZD)/7
NZD = (FX:NZDJPY/100+FX:NZDUSD+FX:NZDCHF+SAXO:NZDGBP+FX:NZDCAD+SAXO:NZDAUD+SAXO:NZDEUR)/7
CRYPTO = (BITSTAMP:BTCUSD+BITSTAMP:ETHUSD+BITSTAMP:LTCUSD+BITSTAMP:BCHUSD)/4
Timeframes :
As mentioned in the prerequisites, the chart timeframe must not be greater than the trading timeframe. The latter corresponds to the timeframe chosen by the trader to enter a position, and is the indicator's first parameter. Once this has been chosen, the algorithm selects the timeframes of the "Trend" and "Velocity" charts. Here's how it allocates them :
Trading TF => ("Velocity TF", "Trend TF")
"5min" => ("15min ", "60min")
"15min" => ("60min ", "4h")
"30min" => ("2h ", "8h")
"60min" => ("4h ", "12h")
"4h" => ("12h", "1D")
"6h" => ("1D", "3D")
"8h" => ("1D", "4D")
"12h" => ("2D", "1W")
"1D" => ("3D", "1W")
Trend Scoring System :
When the timeframe of the trend graph has been allocated, the algorithm will establish this graph's score using three criteria :
Trend chart pivot points: if the last two pivots, high and low, are increasing, the score is 1; if they are decreasing, the score is -1; else the score is 0.
SMA: if its slope is increasing with a candle strictly above the SMA value, the score is 1; if its slope is decreasing with a candle strictly below it, the score is -1; otherwise, it is 0.
MACD: if the MACD is positive, the score is 1, if it is negative, the score is -1; else it's 0.
We then sum the scores of these three criteria to find the trend score.
Velocity Scoring System :
In the same way, we analyze the score of the "velocity" graph with its corresponding timeframe using three criteria :
The EMA: if its slope is increasing with a candle strictly above the EMA value, the score is 1; if its slope is decreasing with a candle strictly below it, the score is -1; otherwise, it is 0.
The RSI: if the RSI's EMA has an increasing slope with an RSI strictly greater than the value of this EMA, the score is 1; and if the RSI's EMA has a decreasing slope with an RSI strictly less than this EMA, the score is -1; otherwise it is 0.
SAR parabolic: if the SAR is below the price, the score is 1; if it is above the price, the score is -1.
We then sum the scores of these three criteria to find the velocity score.
Relative Strength Scoring System :
Once the trend score and velocity score have been calculated, we determine the relative strength score of each currency using the following algorithm :
If trend score >=2 and velocity score >=2, the currency is bullish.
If trend score <=2 and velocity score <=2, currency is bearish
If (trendScore>=2 or velocityScore>=2) and (trendScore=1 or velocityScore=1) the currency is not yet bullish
If (trendScore<=2 or velocityScore<=2) and (trendScore=-1 or velocityScore=-1) the currency is not yet bearish.
Otherwise the currency is neutral
Parameters :
Trading Timeframe: the trading timeframe chosen by the trader for which he makes his position entry and exit decisions. Default is 1h
Pivot Legs: Parameter used for the chart "Trend" setting the pivot strength to the right and left of high/low. Default is 2
SMA Length: SMA length of the chart "Trend". Default is 20
MACD Fast Length: Length of the MACD fast SMA calculated on the chart "Trend". Default is 12
MACD Slow Length: Length of the MACD slow SMA calculated on the chart "Trend". Default is 26
MACD Signal Length: Length of the MACD signal SMA calculated on the chart "Trend". Default is 9
EMA Length: EMA length of the "Velocity" graph. Default is 13
RSI Length: RSI length of the "Velocity" graph. Default is 14
RSI EMA Length: Length of the RSI EMA. Default is 9
Parabolic SAR Start: Start of the SAR parabola in the "Velocity" graph. Default is 0.02
Parabolic SAR Increment: Increment of the SAR parabola in the "Velocity" graph. Default is 0.02
Parabolic SAR Max: Maximum of the SAR parabola in the "Velocity" graph. Default is 0.2
Conclusion :
This indicator has been designed to determine the relative strength of the major currencies against each other. The aim is to know which pair to trade at the right time in order to maximize the probability of a successful trade. For example, if the USD is bullish and the NZD bearish, we'll short the NZDUSD pair.
Enjoy this indicator and don't forget to take the trade ;)

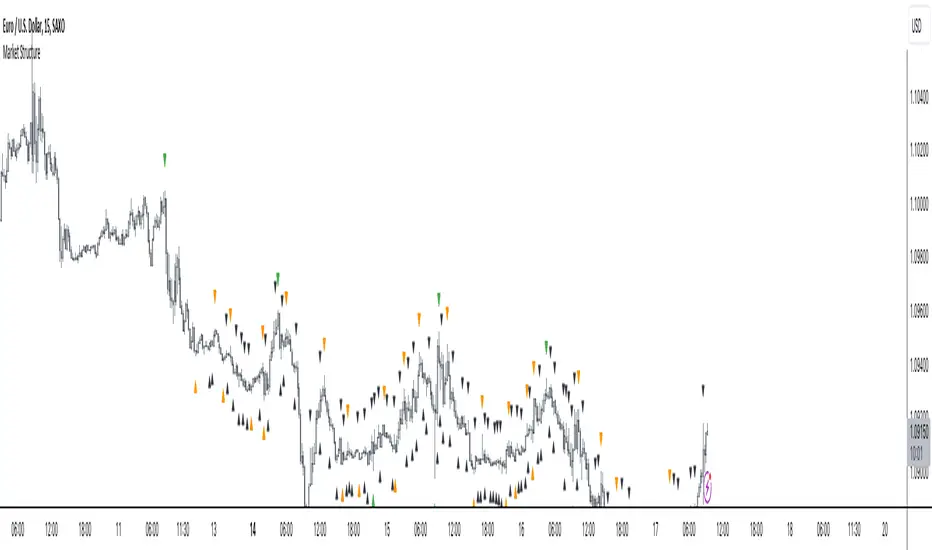
Market Structure
Intermediate Term Low (ITL): A point on a price chart where the price reaches a relatively lower level compared to the surrounding price points within an intermediate time frame.
Intermediate Term High (ITH): A point on a price chart where the price reaches a relatively higher level compared to the surrounding price points within an intermediate time frame.
Long Term Low (LTL): An Intermediate Term Low (ITL) that has higher Intermediate Term Lows (ITL) on both sides of it, indicating a potential significant reversal point and considered a long term trend change.
Long Term High (LTH): An Intermediate Term High (ITH) that has lower Intermediate Term Highs (ITH) on both sides of it, indicating a potential significant reversal point and considered a long term trend change
The script designed to automatically identify these patterns on a price chart. It categorizes ITH/L and LTH/L points for easy recognition of the market structure and potential pivot points. Traders and analysts often use such patterns and pivot points to make decisions about entering or exiting positions in the market.
Please note that while these concepts are based on certain patterns observed in historical price data, trading and investing in financial markets can be complex and risky. It's important to have a solid understanding of technical analysis, risk management, and market dynamics before making trading decisions.
ICT Institutional Order Flow (fadi)ICT Institutional Order Flow indicator is intended to provide wholistic view to better analyze order flow and where price may go to next. The concept follows ICT principles.
ICT Market Structure
ICT breaks down Pivot points into three categories:
Short Term High/Low (STH/STL) is a 3 candle pattern with a low with higher low on each side (STL), or a high with lower high on each side (STH)
Intermediate Term High/Low (ITH/ITL) uses the calculated STH/STL and marks any STH that has lower or STH on each side, and STL that has higher STL on each side
Long Term High/Low (LTH/LTL) uses the calculated ITH/ITL and marks any ITH that has lower or ITH on each side, and ITL that has higher ITL on each side
Note: ICT also states that if a STH wicks into and closes (almost?) a FVG, he marks it as ITH even if it does not have STH on reach side. This scenario is not covered by this indicator
Liquidity
liquidity is usually present under pivot points. The more prominent the pivot point, the more likely higher values liquidity pools reside under/above it. Liquidity under ITL and LTL as an example, will have better indication of which liquidity the price may seek next.
Displacement
Displacement registers above average move in the price resulting in strong visible move. If requiring a FVG is enabled (in settings), then the displacement could possibly (but never guaranteed) be used to visually recognize a move as it develops.
Full Credit: The calculation for Displacement is derived from TFO's Visualizing Displacement
Imbalances
Imbalances can come in different forms. This indicator identifies three type of imbalances:
1. FVG
2. Volume Imbalance
3. Open Gaps
Imbalances completes the picture by help visualize strong moves, where possible pivot points may develop, and how to enter or manage a trade.

Band-Zigzag Based Trend FollowerWe defined new method to derive zigzag last month - which is called Channel-Based-Zigzag . This script is an example of one of the use case of this method.
🎲 Trend Following
Defining a trend following method is simple. Basic rule of trend following is Buy High and Sell Low (Yes, you heard it right). To explain further - methodology involve finding an established trend which is flying high and join the trend with proper risk and optimal stop. Once you get into the trade, you will not exit unless there is change in the trend. Or in other words, the parameters which you used to define trend has reversed and the trend is not valid anymore.
Few examples are:
🎯 Using bands
When price breaks out of upper bands (example, Bollinger Band, Keltener Channel, or Donchian Channel), with a pre determined length and multiplier, we can consider the trend to be bullish and similarly when price breaks down the lower band, we can consider the trend to be bearish.
Here are few examples where I have used bands for identifying trend
Band-Based-Supertrend
Donchian-Channel-Trend-Filter
🎯 Using Pivots
Simple logic using zigzag or pivot points is that when price starts making higher highs and higher lows, we can consider this as uptrend. And when price starts making lower highs and lower lows, we can consider this as downtrend. There are few supertrend implementations I have published in the past based on zigzags and pivot points.
Adoptive-Supertrend-Pivots
Zigzag-Supertrend
Drawbacks of both of these methods is that there will be too many fluctuations in both cases unless we increase the reference length. And if we increase the reference length, we will have higher drawdown.
🎲 Band Based Zigzag Method
Band Based Zigzag will help overcome these issues by combining both the methods.
Here we use bands to define our pivot high and pivot low - this makes sure that we are identifying trend only on breakouts as pivots are only formed on breakouts.
Our method also includes pivot ratio to cross over 1.0 to be able to consider it as trend. This means, we are waiting for price also to make new high high or lower low before making the decision on trend. But, this helps us ignore smaller pivot movements due to the usage of bands.
I have also implemented few tricks such as sticky bands (Bands will not contract unless there is breakout) and Adaptive Bands (Band will not expand unless price is moving in the direction of band). This makes the trend following method very robust.
To avoid fakeouts, we also use percentB of high/low in comparison with price retracement to define breakout.
🎲 The indicator
The output of indicator is simple and intuitive to understand.
🎯 Trend Criteria
Uptrend when last confirmed pivot is pivot high and has higher retracement ratio than PercentB of High. Else, considered as downtrend.
Downtrend when last confirmed pivot is pivot low and has higher retracement ratio than PercentB of High. Else, considered as uptrend.
🎯 Settings
Settings allow you to select the band type and parameters used for calculating zigzag and then trend. Also has few options to hide the display.

FluidTrades - SMC Lite
Price action and supply and demand is a key strategy use in trading. We wanted it to be easy and efficient for user to identify these zones, so the user can focus less on marking up charts and focus more on executing trades.
This indicator shows you supply and demand zones by using pivot points to show you the recent highs and the recent lows.
Features
This indicator includes some features relevant to SMC , these are highlighted below:
Full internal & swing market structure labeling in real-time
Swing Structure: Displays the swing structure labels & solid lines on the chart (BOS).
Supply & demand ( bullish & bearish )
Swing Points: Displays swing points labels on chart such as HH, HL, LH, LL.
Options to style the indicator to more easily display these concepts
White OB (supply): search for short opportunities
Blue OB (demand): search for long opportunities
Break of structure ( BOS )
For markets to move up and down a break in market structure must occur. A break in market structure occurs when the market begins to shift direction and break the previous HH and HL or HL and LL of the market. We also integrated the feature that you can see the BOS lines. In the indicator settings you can adjust the color of the label.
Settings
SwingHigh/Low Length: Allows the user to select Historical (default) or Present, which displays only recent data on the chart.
Supply/demand box width: Allows user to change the size of the supply and demand box
History to keep: allows the user to select how many most recent supply & demand box appear on the chart.
Visual settings
Show zig zag : allow user to see market patters within the market
Show price action labels: allow user to turn on/off the (swing points)
Supply box color : allow users to change the color of their supply box
Demand box color : allow users to change the color of their supply box
Bos label color : allow users to change the color of their BOS label
Poi label color : allow user to change the color of their POI label
Price action label : allow users to change the color of their swing points labels
Zig zag color : allow users to change the color of the zig/zag market patters
Warning
Never blindly take a trade on a supply/demand box - wait for a proper market structure to occur before considering a trade.

Support Resistance - Dynamic v2Hello Traders!
After the addition of "Arrays" to the Pine, I developed new and improved version of Support Resistance - Dynamic script as version 2. In this script Arrays were used. This can be used as Support Resistance tool, also it will be an example for the people who want to learn Array usage in Pine. Many thanks to Pine Team for adding Arrays!
The script finds the Pivot Points and check them in channels if there can be S/R or not, and draws mid line of the channel as S/R line. you can set number of PPs and channel width in the options. Each channel width is optimized dynamically according to Pivot Points. Also you can choose " High/Low " or " Close/Open " as source for Pivot Points.
There is an option for maximum number of S/R levels. S/R levels are found and sorted dynamically and number of S/R lines with enough strength changes dynamically.
Some other options for coloring and line width. (Solid, Dashed or Dotted)
S/R levels are shown in the Labels and Label colors are changed automatically, if S/R line is below the closing price then it's color is Green (as Support), otherwise its color is Red (as Resistance).
Examples:
Enjoy!

Support Resistance📌 1. Indicator Name
Premium Auto Support & Resistance
📌 2. One-Line Description
An automated S/R system that generates support and resistance zones based on swing highs and lows, displaying them in a premium visual style directly on the chart.
📌 3. Overall Summary (7+ lines)
This indicator automatically detects price levels where the market has repeatedly reacted and generates support and resistance zones.
Instead of simple horizontal lines, it visualizes reaction ranges as zones, helping traders clearly understand the actual price areas where activity occurs.
It uses swing points (high/low pivots) as the fundamental basis and continuously updates only the most meaningful recent S/R levels.
A smoothing process is applied, reducing noise and creating more natural, reliable S/R zones.
Support and resistance are displayed as filled transparency-based zones, enabling intuitive identification of zone strength and market position.
When price touches one of these zones, a small signal appears to highlight potential reversal points.
All elements are plotted directly over the candles with overlay=true, making it an instantly usable and visually premium tool.
📌 4. Advantages (6 items)
① Automatic Swing-Based S/R Detection
Automatically analyzes key pivot points and extracts only the most meaningful support and resistance levels.
② Support/Resistance Zone Structure
Provides intuitive reaction ranges instead of single lines, making it far more practical for real trading.
③ Smooth Premium-Style Lines
S/R lines are smoothed to remove noise, maintaining a natural and refined premium visual appearance.
④ Automatic Candle-Touch Alerts
Displays signals whenever price touches support or resistance, helping you quickly identify potential reversal areas.
⑤ Overlay-Based Immediate Clarity
Drawn directly onto the chart without occupying indicator windows, keeping visual focus on price action.
⑥ Simple Yet Powerful Framework
A pivot + smoothing + zone combination that strengthens automatic S/R detection while remaining easy for beginners to use.

ProScalper📊 ProScalper - Professional 1-Minute Scalping System
🎯 Overview
ProScalper is a sophisticated, multi-confluence scalping indicator designed specifically for 1-minute chart trading. Combining advanced technical analysis with intelligent signal filtering, it provides high-probability trade setups with clear entry, stop loss, and take profit levels.
✨ Key Features
🔺 Smart Signal Detection
Range Filter Technology: Fast-responding trend detection (25-period) optimized for 1-minute timeframe
Medium-sized triangles appear above/below candles for clear buy/sell signals
Only most recent signal shown - no chart clutter
Automatically deletes old signals when new ones appear
📋 Real-Time Signal Table
Top-center display shows complete trade breakdown
Grade system: A+, A, B+, B, C+ ratings for every setup
All confluence reasons listed with checkmarks
Score and R:R displayed for instant trade quality assessment
Color-coded: Green for LONG, Red for SHORT
📐 Multi-Confluence Analysis
ProScalper combines 10+ technical factors:
✅ EMA Trend: 4 EMAs (200, 48, 13, 8) for multi-timeframe alignment
✅ VWAP: Dynamic support/resistance
✅ Fibonacci Retracement: Golden ratio (61.8%), 50%, 38.2%, 78.6%
✅ Range Filter: Adaptive trend confirmation
✅ Pivot Points: Smart reversal detection
✅ Volume Analysis: Spike detection and volume profile
✅ Higher Timeframe: 5-minute trend confirmation
✅ HTF Support/Resistance: Key levels from higher timeframes
✅ Liquidity Sweeps: Smart money detection
✅ Opening Range Breakout: First 15-minute range
💰 Complete Trade Management
Entry Lines: Dashed green (LONG) or red (SHORT) showing exact entry
Stop Loss: Red dashed line with price label
Take Profit: Blue dashed line with price label and R:R
Partial Exits: 1R level marked with orange dashed line
All lines extend 10 bars for clean alignment with Fibonacci levels
📊 Dynamic Risk/Reward
Adaptive R:R calculation based on market volatility
Targets adjusted for pivot distances
Minimum 1.2:1 to maximum 3.5:1 for scalping
Position sizing based on account risk percentage
🎨 Professional Visualization
Clean chart layout - no clutter, only essential information
Custom EMA colors: Red (200), Aqua (48), Green (13), White (8)
Gold VWAP line for key support/resistance
Color-coded Fibonacci: Bright yellow (61.8%), white (50%), orange (38.2%), fuchsia (78.6%)
No shaded zones - pure price action focus
📈 Performance Tracking
Real-time statistics table (optional)
Win rate, total trades, P&L tracking
Average R:R and win/loss ratios
Setup-specific performance metrics
⚙️ Settings & Customization
Risk Management
Adjustable account risk per trade (default: 0.5%)
ATR-based stop loss multiplier (default: 0.8 for tight scalping)
Dynamic position sizing
Signal Sensitivity
Confluence Score Threshold: 40-100 (default: 55 for balanced signals)
Range Filter Period: 25 bars (fast signals for 1-min)
Range Filter Multiplier: 2.2 (tighter bands for more signals)
Visual Controls
Toggle signal table on/off
Show/hide Fibonacci levels
Control EMA visibility
Adjust table text size
Partial Exits
1R: 50% (default)
2R: 30% (default)
3R: 20% (default)
Fully customizable percentages
Trailing Stops
ATR-Based (best for scalping)
Pivot-Based
EMA-Based
Breakeven trigger at 0.8R
🎯 Best Use Cases
Ideal For:
✅ 1-minute scalping on liquid instruments
✅ Day traders looking for quick 2-8 minute trades
✅ High-frequency trading with 8-15 signals per session
✅ Trending markets where Range Filter excels
✅ Crypto, Forex, Futures - works on all liquid assets
Trading Style:
Timeframe: 1-minute (can work on 3-5 min with adjusted settings)
Hold Time: 3-8 minutes average
Target: 1.2-3R per trade
Frequency: 8-15 signals per day
Win Rate: 45-55% (with proper risk management)
📋 How to Use
Step 1: Wait for Signal
Watch for green triangle (BUY) or red triangle (SELL)
Signal table appears at top center automatically
Step 2: Review Confluence
Check grade (prefer A+, A, B+ for best quality)
Review all reasons listed in table
Confirm score is above your threshold (55+ recommended)
Note the R:R ratio
Step 3: Enter Trade
Enter at current market price
Set stop loss at red dashed line
Set take profit at blue dashed line
Mark 1R level (orange line) for partial exit
Step 4: Manage Trade
Exit 50% at 1R (orange line)
Move to breakeven after 0.8R
Trail remaining position using your chosen method
Exit fully at TP or opposite signal
🎨 Chart Setup Recommendations
Optimal Display:
Timeframe: 1-minute
Chart Type: Candles or Heikin Ashi
Background: Dark theme for best color visibility
Volume: Enable volume bars below chart
Complementary Indicators (optional):
Order flow/Delta for institutional confirmation
Market profile for key levels
Economic calendar for news avoidance
⚠️ Important Notes
Risk Disclaimer:
Not financial advice - for educational purposes only
Always use proper risk management (0.5-1% per trade max)
Past performance doesn't guarantee future results
Test on demo account before live trading
Best Practices:
✅ Trade during high liquidity hours (9:30-11 AM, 2-4 PM EST)
✅ Avoid news events and market open/close (first/last 2 minutes)
✅ Use tight stops (0.8-1.0 ATR) for 1-minute scalping
✅ Take partial profits quickly (1R = 50% off)
✅ Respect max daily loss limits (3% recommended)
✅ Focus on A and B grade setups for consistency
What Makes This Different:
🎯 Complete system - not just signals, but full trade management
📊 Multi-confluence - 10+ factors analyzed per trade
🎨 Professional visualization - clean, focused chart design
⚡ Optimized for 1-min - settings specifically tuned for fast scalping
📋 Transparent reasoning - see exactly why each trade was taken
🏆 Grade system - instantly know trade quality
🔧 Technical Details
Pine Script Version: 5
Overlay: Yes (plots on price chart)
Max Lines: 500
Max Labels: 100
Non-repainting: All signals confirmed on bar close
Alerts: Compatible with TradingView alerts
📞 Support & Updates
This indicator is actively maintained and optimized for 1-minute scalping. Settings can be adjusted for different timeframes and trading styles, but default configuration is specifically tuned for high-frequency 1-minute scalping.
🚀 Get Started
Add ProScalper to your 1-minute chart
Adjust settings to your risk tolerance
Wait for signals (green/red triangles)
Follow the signal table guidance
Manage trades using provided levels
Track performance with stats table
Happy Scalping! 📊⚡💰

S&P Trading System with PivotsThe S&P Trading System with Pivots is a TradingView indicator designed for the 30-minute SPX chart to guide SPY options trading. It uses a trend-following strategy with:
10 SMA and 50 SMA: Plots a 10-period (blue) and 50-period (red) Simple Moving Average. A bullish crossover (10 SMA > 50 SMA) signals a potential buy (green triangle below bar), while a bearish crossunder (10 SMA < 50 SMA) signals a sell or exit (red triangle above bar).
Trend Bias: Colors the background green (bullish) or red (bearish) based on SMA positions.
Pivot Points: Marks recent highs (orange circles) and lows (purple circles) as potential resistance and support levels, using a 5-bar lookback period.

TradeVision Pro - Multi-Factor Analysis System═══════════════════════════════════════════════════════════════════
TRADEVISION PRO - MULTI-FACTOR ANALYSIS SYSTEM
Created by Zakaria Safri
═══════════════════════════════════════════════════════════════════
A comprehensive technical analysis tool combining multiple factors for
signal generation, trend analysis, and dynamic risk management visualization.
Designed for educational purposes to study multi-factor convergence trading
strategies across all markets and timeframes.
⚠️ IMPORTANT DISCLAIMER:
This indicator is provided for EDUCATIONAL and INFORMATIONAL purposes only.
It does NOT constitute financial advice, investment advice, or trading advice.
Past performance does not guarantee future results. Trading involves
substantial risk of loss. Always do your own research and consult a
financial advisor before making trading decisions.
🎯 KEY FEATURES
═══════════════════════════════════════════════════════════════════
✅ MULTI-FACTOR SIGNAL GENERATION
• Price Volume Trend (PVT) analysis
• Rate of Change (ROC) momentum confirmation
• Volume-Weighted Moving Average (VWMA) trend filter
• Simple Moving Average (SMA) price smoothing
• Signals only when all factors align
✅ DYNAMIC RISK VISUALIZATION (Educational Only)
• ATR-based stop loss calculation
• Risk-reward based take profit levels (1-5 targets)
• Visual lines and labels showing entry, SL, and TPs
• Automatically adapts to market volatility
• ⚠️ VISUAL REFERENCE ONLY - Does not execute trades
✅ SUPPORT & RESISTANCE DETECTION
• Automatic pivot-based level identification
• Red dashed lines for resistance zones
• Green dashed lines for support areas
• Helps identify key price levels
✅ VWMA TREND BANDS
• Volume-weighted moving average with standard deviation
• Color-changing bands (Green = Uptrend, Red = Downtrend)
• Filled band area for easy visualization
• Volume-confirmed trend strength
✅ TREND DETECTION SYSTEM
• Counting-based trend confirmation
• Three states: Up Trend, Down Trend, Ranging
• Requires threshold of consecutive bars
• Independent trend validation
✅ PRICE RANGE VISUALIZATION
• High/Low range lines showing market structure
• Filled area highlighting price volatility
• Helps identify breakout zones
✅ COMPREHENSIVE INFO TABLE
• Real-time trend status
• Last signal type (BUY/SELL)
• Entry price display
• Stop loss level
• All active take profit levels
• Clean, professional layout
✅ OPTIONAL FEATURES
• Bar coloring by trend direction
• Customizable alert notifications
• Toggle visibility for all components
• Fully configurable parameters
📊 HOW IT WORKS
═══════════════════════════════════════════════════════════════════
SIGNAL METHODOLOGY:
BUY SIGNAL generates when ALL conditions are met:
• Smoothed price > Moving Average (upward price trend)
• PVT > PVT Average (volume supporting uptrend)
• ROC > 0 (positive momentum)
• Close > VWMA (above volume-weighted average)
SELL SIGNAL generates when ALL conditions are met:
• Smoothed price < Moving Average (downward price trend)
• PVT < PVT Average (volume supporting downtrend)
• ROC < 0 (negative momentum)
• Close < VWMA (below volume-weighted average)
This multi-factor approach filters out weak signals and waits for
strong convergence before generating alerts.
RISK CALCULATION:
Stop Loss = Entry ± (ATR × SL Multiplier)
• Uses Average True Range for volatility measurement
• Automatically adjusts to market conditions
Take Profit Levels = Entry ± (Risk Distance × TP Multiplier × Level)
• Risk Distance = |Entry - Stop Loss|
• Creates risk-reward based targets
• Example: TP Multiplier 1.0 = 1:1, 2:2, 3:3 risk-reward
⚠️ NOTE: All risk levels are VISUAL REFERENCES for educational study.
They do not execute trades automatically.
⚙️ SETTINGS GUIDE
═══════════════════════════════════════════════════════════════════
SIGNAL SETTINGS:
• Signal Length (14): Main calculation period for averages
• Smooth Length (8): Price data smoothing period
• PVT Length (14): Price Volume Trend calculation period
• ROC Length (9): Rate of Change momentum period
RISK MANAGEMENT (Visual Only):
• ATR Length (14): Volatility measurement lookback
• SL Multiplier (2.2): Stop loss distance (× ATR)
• TP Multiplier (1.0): Risk-reward ratio per TP level
• TP Levels (1-5): Number of take profit targets to display
• Show TP/SL Lines: Toggle visual reference lines
SUPPORT & RESISTANCE:
• Pivot Lookback (10): Sensitivity for S/R detection
• Show SR: Toggle support/resistance lines
VWMA BANDS:
• VWMA Length (20): Volume-weighted average period
• Show Bands: Toggle band visibility
TREND DETECTION:
• Trend Threshold (5): Consecutive bars required for trend
PRICE LINES:
• Period (20): High/low calculation lookback
• Show: Toggle price range visualization
DISPLAY OPTIONS:
• Signals: Show/hide BUY/SELL labels
• Table: Show/hide information panel
• Color Bars: Enable trend-based bar coloring
ALERTS:
• Enable: Activate alert notifications for signals
💡 USAGE INSTRUCTIONS
═══════════════════════════════════════════════════════════════════
RECOMMENDED APPROACH:
• Works on all timeframes (1m to Monthly)
• Suitable for all markets (Stocks, Forex, Crypto, etc.)
• Best used with additional analysis and confirmation
• Always practice proper risk management
ENTRY STRATEGY:
1. Wait for BUY or SELL signal to appear
2. Check trend table for trend confirmation
3. Verify VWMA band color matches signal direction
4. Look for nearby support/resistance confluence
5. Consider entering on next candle open
6. Use visual SL level for risk management
EXIT STRATEGY:
1. Use TP levels as potential exit zones
2. Consider scaling out at multiple TP levels
3. Exit on opposite signal
4. Adjust stops as trade progresses
5. Account for spread and slippage
TREND TRADING:
• "Up Trend" → Focus on BUY signals
• "Down Trend" → Focus on SELL signals
• "Ranging" → Wait for clear trend or use range strategies
🎨 VISUAL ELEMENTS
═══════════════════════════════════════════════════════════════════
• GREEN VWMA BANDS → Bullish trend indication
• RED VWMA BANDS → Bearish trend indication
• ORANGE DASHED LINE → Entry price reference
• RED SOLID LINE → Stop loss level
• GREEN DOTTED LINES → Take profit targets
• RED DASHED LINES → Resistance levels
• GREEN DASHED LINES → Support levels
• GREY FILLED AREA → Price high/low range
• GREEN BUY LABEL → Long signal
• RED SELL LABEL → Short signal
• BLUE INFO TABLE → Current trade details
• GREEN/RED BARS → Trend direction (optional)
⚠️ IMPORTANT NOTES
═══════════════════════════════════════════════════════════════════
RISK WARNING:
• Trading involves substantial risk of loss
• You can lose more than your initial investment
• Past performance does not guarantee future results
• No indicator is 100% accurate
• Always use proper position sizing
• Never risk more than you can afford to lose
EDUCATIONAL PURPOSE:
• This tool is for learning and research
• Not a complete trading system
• Should be combined with other analysis
• Requires interpretation and context
• Test thoroughly before live use
• Consider consulting a financial advisor
TECHNICAL LIMITATIONS:
• Signals lag price action (all indicators lag)
• False signals occur in choppy markets
• Works better in trending conditions
• Support/resistance levels are approximate
• TP/SL levels are suggestions, not guarantees
📚 METHODOLOGY
═══════════════════════════════════════════════════════════════════
This indicator combines established technical analysis concepts:
• Price Volume Trend (PVT): Volume-weighted price momentum
• Rate of Change (ROC): Momentum measurement
• Volume-Weighted Moving Average (VWMA): Trend identification
• Average True Range (ATR): Volatility measurement (J. Welles Wilder)
• Pivot Points: Support/resistance detection
All methods are based on publicly available technical analysis
principles. No proprietary or "secret" algorithms are used.
⚖️ FULL DISCLAIMER
═══════════════════════════════════════════════════════════════════
LIABILITY:
The creator (Zakaria Safri) assumes NO liability for:
• Trading losses or damages of any kind
• Loss of capital or profits
• Incorrect signal interpretation
• Technical issues, bugs, or errors
• Any consequences of using this tool
USER RESPONSIBILITY:
By using this indicator, you acknowledge that:
• You are solely responsible for your trading decisions
• You understand the substantial risks involved
• You will not hold the creator liable for losses
• You will conduct your own research and analysis
• You may consult a licensed financial professional
• You are using this tool entirely at your own risk
AS-IS PROVISION:
This indicator is provided "AS IS" without warranty of any kind,
express or implied, including but not limited to warranties of
merchantability, fitness for a particular purpose, or non-infringement.
The creator is not a registered investment advisor, financial planner,
or broker-dealer. This tool is not approved or endorsed by any
financial authority.
📞 ABOUT THE CREATOR
═══════════════════════════════════════════════════════════════════
Created by: Zakaria Safri
Specialization: Technical analysis indicator development
Focus: Multi-factor analysis, risk visualization, trend detection
This is an educational tool designed to demonstrate technical
analysis concepts and multi-factor signal generation methods.
📋 VERSION INFO
═══════════════════════════════════════════════════════════════════
Version: 1.0
Platform: TradingView Pine Script v5
License: Mozilla Public License 2.0
Creator: Zakaria Safri
Year: 2024
═══════════════════════════════════════════════════════════════════
Study Carefully, Trade Wisely, Manage Risk Properly
TradeVision Pro - Educational Trading Tool
Created by Zakaria Safri
═══════════════════════════════════════════════════════════════════

BE-Fib Channel 2 Sided Trading█ Overview:
"BE-Fib Channel 2 Sided Trading" indicator is built with the thought of 2 profound setups named "Cup & Handle (C&H)" and "Fibonacci Channel Trading (FCT)" with the context of "day trading" or with a minimum holding period.
█ Similarities, Day Trading Context & Error Patterns:
While the known fact is that both C&H and FCT provide setups with lesser risk with bigger returns, they both share the similar "Base Pattern".
Note: Inverse of the above Image shall switch the setups between long vs short.
Since the indicator is designed for smaller time-frame candles, there may be instances where the "base pattern" does not visually resemble a Cup & Handle (C&H) pattern. However, patterns are validated using pivot points. The points labeled "A" and "C" can be equal or slightly slanted. Settings of the Indicator allows traders a flexibility to control the angle of these points to spot the strategies according to set conditions. Therefore, understanding the nuances of these patterns is crucial for effective decision-making.
█ 2 Sided Edge: FCT suggests to take trade closer to the yellow line to get better RR ratio. this leaves a small chance of doubt as to; what if price is intended to break the Yellow line thereby activating the C&H.
Wait for the confirmation is a Big FOMO with a compromised RR.
Hence, This indicator is designed to handle both the patterns based on the strength, FIFO and pattern occurring delay.
█ How to Use this Indicator:
Step 1: Enable the Show Sample Sensitivity option to understand the angle of yellow line shown in the sample image. By enabling this option, On the last bar you shall see 4 lines being plotted depicting the max angle which is acceptable for both long and short trades.
Note: Angle can be controlled via setting "Sensitivity".
Higher Sensitivity --> Higher Setup identification --> can lead to failed setups due to 2 sided trading.
Lower Sensitivity --> Lower Setup identification --> can increase the changes of being right.
Step 2: Adjust the look back & look forward periods which shall be used for identifying patterns.
Note: Smaller values can lead to more setups being identified but can hamper the performance of the indicator while increasing the chances of failures. larger values identifies more significant setup but leads to more waiting period thereby compromising on the RR.
Step 3: Adjust the Base Range.
Note: Smaller values can lead to more setups being identified but can hamper the performance of the indicator while increasing the chances of failures. larger values identifies more significant setup but leads to more Risk on play.
Step 4: set the Entry level for FCT & Set the SL for Both FCT & C&H and Target Reward ratio for C&H.
█ Features of Indicator & How it works:
1. Patterns are being identified using Pivot Points method.
2. Tracks & validates both the setups simultaneously on every candle and traded one at a time based on FIFO, New setups found in-between, Defined Entry Levels while on wait for the other pattern to get activated.
3. Alerts added for trade events.
4. FCT setups are generally traded with trailed SL level and increasing Target level on every completed bar. while C&H has the standard SL & TP level with no Trail SL option.
DISCLAIMER: No sharing, copying, reselling, modifying, or any other forms of use are authorized for our documents, script / strategy, and the information published with them. This informational planning script / strategy is strictly for individual use and educational purposes only. This is not financial or investment advice. Investments are always made at your own risk and are based on your personal judgement. I am not responsible for any losses you may incur. Please invest wisely.
Happy to receive suggestions and feedback in order to improve the performance of the indicator better.

Angle Market Structure [BigBeluga]🔵 OVERVIEW
Angle Market Structure is a smart pivot-based tool that dynamically adapts to price action by accelerating breakout and breakdown detection. It draws market structure levels based on pivot highs/lows and gradually adjusts those levels closer to price using an angle threshold. Upon breakout, the indicator projects deviation zones with labeled levels (+1, +2, +3 or −1, −2, −3) to track price extension beyond structure.
🔵 CONCEPTS
Adaptive Market Structure: Uses pivots to define structure levels, which dynamically angle closer to price over time to capture breakouts sooner.
Breakout Acceleration: Pivot high levels decrease and pivot low levels increase each bar using a user-defined angle (based on ATR), improving reactivity.
Deviation Zones: Once a breakout or breakdown occurs, 3 deviation levels are projected to show how far price extends beyond the breakout point.
Count Labels: Each successful structure break is numbered sequentially, giving traders insight into momentum and trend persistence.
Visual Clarity: The script uses colored pivot points, trend lines, and extension labels for easy structural interpretation.
🔵 FEATURES
Calculates pivot highs and lows using a customizable length.
Applies an angle modifier (ATR-based) to gradually pull levels closer to price.
Plots breakout and breakdown lines in distinct colors with automatic extension.
Shows deviation zones (+1, +2, +3 or −1, −2, −3) after breakout with customizable size.
Color-coded labels for trend break count (bullish or bearish).
Dynamic label sizing and theme-aware colors.
Smart label positioning to avoid chart clutter.
Built-in limit for deviation zones to maintain clarity and performance.
🔵 HOW TO USE
Use pivot-based market structure to identify breakout and breakdown zones.
Watch for crossover (up) or crossunder (down) events as trend continuation or reversal signals.
Observe +1/+2/+3 or -1/-2/-3 levels for overextension opportunities or trailing stop ideas.
Use breakout count as a proxy for trend strength—multiple counts suggest momentum.
Combine with volume or order flow tools for higher confidence entries at breakout points.
Adjust the angle setting to fine-tune sensitivity based on market volatility.
🔵 CONCLUSION
Angle Market Structure enhances traditional pivot-based analysis by introducing breakout acceleration and structured deviation tracking. It’s a powerful tool for traders seeking a cleaner, faster read on market structure and momentum strength—especially during impulsive price moves or structural transitions.

Metatron Lines (Highs & Lows Geometry)Metatron Lines
Hey TradingView community! 👋
I wanted to share something I've been working on that might help you see market structure from a different angle. This indicator connects pivot highs and lows using geometric patterns, creating what I call "Metatron Lines."
What it does (simply put):
- Finds significant highs and lows on your chart
- Draws lines connecting these points to reveal hidden geometric relationships
- Shows you the underlying structure that price tends to respect
Why I built this:
I noticed that markets often move in patterns that aren't immediately obvious. Sometimes the most important levels aren't the obvious support and resistance lines, but the intersections and angles created by connecting multiple pivot points. This tool helps visualize those relationships.
How it might help you:
- Pattern Recognition : Spot geometric formations that traditional analysis might miss
- Support/Resistance : See where multiple geometric lines converge to create strong levels
- Market Structure : Better understand how price flows and where it might find obstacles
- Confluence Areas : Identify zones where multiple geometric elements align
A few honest thoughts:
This isn't a magic bullet or a guaranteed profit maker (nothing is!). It's simply another lens through which to view price action. Some traders find geometric analysis helpful, others prefer different approaches - and that's perfectly fine.
I've tried to make it customizable so you can adjust it to fit your trading style and timeframe. The default settings work well for most instruments, but feel free to experiment.
Settings you can adjust:
- Pivot detection sensitivity
- Number of connection points
- Line colors and styles
- Which connections to show (highs, lows, or both)
I hope some of you find this useful! I'm always learning from this community, so if you have suggestions for improvements or different ways to use it, I'd love to hear them.
Trade safe and trust your process! 📈
---
This indicator is provided as-is for educational and analysis purposes. Please practice proper risk management and never risk more than you can afford to lose.

Range Detect SystemTechnical analysis indicator designed to identify potential significant price ranges and the distribution of volume within those ranges. The system helps traders calculate POC and show volume history. Also detecting breakouts or potential reversals. System identifies ranges with a high probability of price consolidation and helps screen out extreme price moves or ranges that do not meet certain volatility thresholds.
⭕️ Key Features
Range Detection — identifies price ranges where consolidation is occurring.
Volume Profile Calculation — indicator calculates the Point of Control (POC) based on volume distribution within the identified range, enhancing the analysis of market structure.
Volume History — shows where the largest volume was traded from the center of the range. If the volume is greater in the upper part of the range, the color will be green. If the volume is greater in the lower part, the color will be red.
Range Filtering — Includes multi-level filtering options to avoid ranges that are too volatile or outside normal ranges.
Visual Customization — Shows graphical indicators for potential bullish or bearish crossovers at the upper and lower range boundaries. Users can choose the style and color of the lines, making it easier to visualize ranges and important levels on the chart.
Alerts — system will notify you when a range has been created and also when the price leaves the range.
⭕️ How it works
Extremes (Pivot Points) are taken as a basis, after confirming the relevance of the extremes we take the upper and lower extremes and form a range. We check if it does not violate a number of rules and filters, perform volume calculations, and only then is the range displayed.
Pivot points is a built-in feature that shows an extremum if it has not been updated N bars to the left and N bars to the right. Therefore, there is a delay depending on the bars specified to check, which allows for a more accurate range. This approach allows not to make unnecessary recalculations, which completely eliminates the possibility of redrawing or range changes.
⭕️ Settings
Left Bars and Right Bars — Allows you to define the point that is the highest among the specified number of bars to the left and right of this point.
Range Logic — Select from which point to draw the range. Maximums only, Minimums only or both.
Use Wick — Option to consider the wick of the candles when identifying Range.
Breakout Confirmation — The number of bars required to confirm a breakout, after which the range will close.
Minimum Range Length — Sets the minimum number of candles needed for a range to be considered valid.
Row Size — Number of levels to calculate POC. *Larger values increase the script load.
% Range Filter — Dont Show Range is than more N% of Average Range.
Multi Filter — Allows use of Bollinger Bands, ATR, SMA, or Highest-Lowest range channels for filtering ranges based on volatility.
Range Hit — Shows graphical labels when price hits the upper or lower boundaries of the range, signaling potential reversal or breakout points.
Range Start — Show points where Range was created.

ICT Judas Swing | Flux Charts💎 GENERAL OVERVIEW
Introducing our new ICT Judas Swing Indicator! This indicator is built around the ICT's "Judas Swing" strategy. The strategy looks for a liquidity grab around NY 9:30 session and a Fair Value Gap for entry confirmation. For more information about the process, check the "HOW DOES IT WORK" section.
Features of the new ICT Judas Swing :
Implementation of ICT's Judas Swing Strategy
2 Different TP / SL Methods
Customizable Execution Settings
Customizable Backtesting Dashboard
Alerts for Buy, Sell, TP & SL Signals
📌 HOW DOES IT WORK ?
The strategy begins by identifying the New York session from 9:30 to 9:45 and marking recent liquidity zones. These liquidity zones are determined by locating high and low pivot points: buyside liquidity zones are identified using high pivots that haven't been invalidated, while sellside liquidity zones are found using low pivots. A break of either buyside or sellside liquidity must occur during the 9:30-9:45 session, which is interpreted as a liquidity grab by smart money. The strategy assumes that after this liquidity grab, the price will reverse and move in the opposite direction. For entry confirmation, a fair value gap (FVG) in the opposite direction of the liquidity grab is required. A buyside liquidity grab calls for a bearish FVG, while a sellside grab requires a bullish FVG. Based on the type of FVG—bullish for buys and bearish for sells—the indicator will then generate a Buy or Sell signal.
After the Buy or Sell signal, the indicator immediately draws the take-profit (TP) and stop-loss (SL) targets. The indicator has three different TP & SL modes, explained in the "Settings" section of this write-up.
You can set up alerts for entry and TP & SL signals, and also check the current performance of the indicator and adjust the settings accordingly to the current ticker using the backtesting dashboard.
🚩 UNIQUENESS
This indicator is an all-in-one suit for the ICT's Judas Swing concept. It's capable of plotting the strategy, giving signals, a backtesting dashboard and alerts feature. Different and customizable algorithm modes will help the trader fine-tune the indicator for the asset they are currently trading. Three different TP / SL modes are available to suit your needs. The backtesting dashboard allows you to see how your settings perform in the current ticker. You can also set up alerts to get informed when the strategy is executable for different tickers.
⚙️ SETTINGS
1. General Configuration
Swing Length -> The swing length for pivot detection. Higher settings will result in
FVG Detection Sensitivity -> You may select between Low, Normal, High or Extreme FVG detection sensitivity. This will essentially determine the size of the spotted FVGs, with lower sensitivies resulting in spotting bigger FVGs, and higher sensitivies resulting in spotting all sizes of FVGs.
2. TP / SL
TP / SL Method ->
a) Dynamic: The TP / SL zones will be auto-determined by the algorithm based on the Average True Range (ATR) of the current ticker.
b) Fixed : You can adjust the exact TP / SL ratios from the settings below.
Dynamic Risk -> The risk you're willing to take if "Dynamic" TP / SL Method is selected. Higher risk usually means a better winrate at the cost of losing more if the strategy fails. This setting is has a crucial effect on the performance of the indicator, as different tickers may have different volatility so the indicator may have increased performance when this setting is correctly adjusted.

Support and Resistance (High Volume Boxes) [ChartPrime]Support and Resistance (High Volume Boxes)
◆ Overview:
The "Support and Resistance" indicator identifies key support and resistance levels using pivot points and volume analysis. It visually represents these levels with dynamically colored boxes, indicating the strength of the volume. This helps traders recognize potential price reversals and key zones for buy and sell opportunities.
◆ Key Features:
Dynamic Support and Resistance Boxes:
The indicator plots support and resistance boxes based on pivot points and volume above threshold for positive volume boxes and below lower threshold for negative volume boxes.
Box colors change from transparent to more intense based on volume, reflecting the strength of support or resistance.
Boxes expands until a new box of the same type appears.
Volume-Based Color Coding:
Boxes are color-coded based on the amount of volume:
Green boxes indicate support levels with positive volume.
Red boxes indicate resistance levels with negative volume.
Hold Signals:
Green diamonds (◆) indicate when support holds, signaling potential buy opportunities.
Red diamonds (◆) indicate when resistance holds, signaling potential sell opportunities.
Breakout Labels:
If the price falls below a support level, that level will become resistance. If the price rises above a resistance level, it will often become support. As the price moves past a level of support or resistance, it is thought that supply and demand has shifted, causing the breached level to reverse its role.
Labels "Break Sup" and "Break Res" are displayed when support or resistance levels are broken, indicating significant market movements.
◆ Break Resistance:
◆Break Support:
◆ Usage Notes:
This indicator helps traders identify strong support and resistance levels, offering visual cues for potential price reversals.
By analyzing volume at these levels, traders can gauge the strength of these zones and make more informed trading decisions.
◆ Settings:
Lookback Period: The number of bars to look back for pivot points.
Delta Volume Filter Length: The length of the volume filter for more accurate volume analysis. (Higher input, will filter low volume boxes)
Adjust Box Width: Adjusts the width of the support and resistance boxes.
This indicator is designed to enhance your trading by providing clear visual cues for support and resistance levels based on volume, making it easier to spot potential price reversals and key trading opportunities.

Implied Orderblock Breaker (Zeiierman)█ Overview
The Implied Order Block Breaker (Zeiierman) is a tool designed to identify enhanced order blocks with imbalances. These enhanced order blocks represent areas where there is a rapid price movement. Essentially, this indicator uses order blocks and suggests that a swift price movement away from these levels, breaking the current market structure, could indicate an area that the market has not correctly valued. This technique offers traders a unique method to identify potential market inefficiencies and imbalances, serving as a guide for potential price revisits.
The indicator doesn't scan for imbalances in the traditional sense — where there's an absence of trades between two price levels — but instead, it identifies quick movements away from key levels that suggest where an imbalance might exist. Relying on crossovers and cross-unders in conjunction with pivot points and examining the high/low within the same period provides an innovative method for traders to spot these potentially undervalued or overvalued areas in the market. These inferred imbalances can be crucial for traders looking for price levels where the market might make significant moves.
█ How It Works
Bullish
Crossover: The closing price of a bar crosses above a pivot high, which is an indication that buyers are in control and pushing the price upwards.
New Low Within Period: There is a lower low within the same period as the pivot high. This suggests that after setting a high, the market pulled back to set a new low, potentially leaving a price gap on the way up as the price quickly recovers.
Bearish
Crossunder: The closing price of a bar crosses under a pivot low, indicating that sellers are taking control and driving the price down.
New High Within Period: There is a higher high within the same period as the pivot low. This condition suggests that the market rallied to a new high before falling back below the pivot low, potentially leaving a gap on the way down.
█ How to Use
The enhanced order blocks are often revisited, and the price may aim to 'fill' the potential imbalance created by the rapid price movement, thereby presenting traders with potential entry or exit points. This approach aligns with the idea that imbalances are frequently revisited by the market, and when combined with the context of Order Blocks, it provides even more confluence.
Example
Here, if the price drops rapidly after setting a new high—crossing under the pivot low—it may skip over certain price levels, creating a 'gap' that signifies an area where the price might have been overvalued (imbalance), which the market may revisit for a potential price correction or revaluation.
█ Settings
Period: Determines the number of bars used for identifying pivot highs and lows. A higher value gives more significant but less frequent signals, while a lower value increases sensitivity but might give more false positives.
Pivot Surrounding: Specifies the number of candles to analyze around a pivot point. Increasing this value broadens the analysis range, potentially capturing more setups but possibly including less significant ones.
-----------------
Disclaimer
The information contained in my Scripts/Indicators/Ideas/Algos/Systems does not constitute financial advice or a solicitation to buy or sell any securities of any type. I will not accept liability for any loss or damage, including without limitation any loss of profit, which may arise directly or indirectly from the use of or reliance on such information.
All investments involve risk, and the past performance of a security, industry, sector, market, financial product, trading strategy, backtest, or individual's trading does not guarantee future results or returns. Investors are fully responsible for any investment decisions they make. Such decisions should be based solely on an evaluation of their financial circumstances, investment objectives, risk tolerance, and liquidity needs.
My Scripts/Indicators/Ideas/Algos/Systems are only for educational purposes!

DB Support Resistance LevelsDB Support Resistance Levels
This indicator plots historic lines for high, low and close prices. The settings allow up to 3 periods to be configured based on the current timeframe. Users can toggle the display of high, low or close values for each period along with customizing the period line color. The indicator does not use the security function. Instead, it's designed to use a period multiplier. Each period allows the user to configure a lookback length and multiplier.
For Example on Weekly
A period lookback of 12 with a multiplier value of 12 on weekly would produce historic high, low and close lines for the last 12 weeks.
A period lookback of 10 with a multiplier value of 4 on weekly would produce historic high, low and close lines for the last 4, 4-week months.
A period lookback of 8 with a multiplier value of 13 on weekly would produce historic high, low and close lines for the last 8, 13-week quarters.
Why not use security with higher timeframe?
The goal was to have the lines start at the precise high, low and close points for the current chart timeframe to allow the user to visually trace the start of the line.
What else does this do?
This indicator also plots the pivot points using TradingView's built-in "pivot_point_levels" feature.
How should I use this indicator?
Traders may use this indicator to gain a visual reference of support and resistance levels from higher periods of time. You can then compare these historic levels against the pivot point levels. In most cases, historic high, low and close levels act as support and resistance levels which can be helpful for judging future market pivot points.
Additional Notes
This indicator does increase the max total lines allowed which may impact performance depending on device specs. No alerts or signals for now. Perhaps coming soon...

MACD ModifiedIn an attempt to improve the MACD for trading, I have added an alternative way to calculate the MACD Line and Overbought/Oversold (OB/OS) lines to filter signals.
The alternate calculation I named "Modified" and put the option to select it under "MACD Calculation" in the input menu. Traditionally the MACD is calculated as fastEMA - slowEMA, for "Modified" I changed the calculation to ((fastEMA - slowEMA) / slowEMA * 100). The goal of this change is to view the difference in MA as a percent of the slow. The hope is that this will compensate for securities that have had major gains or losses in their history.
For the OB/OS lines, I coded in three different ways to calculate them. Users can select which method they prefer in the input menu. The first is through pivot points. The script records the pivot points into an array and takes the average of the array. There are two arrays, one for the OB line and one for the OS line. I also added filters so it will only record pivots above/below a specific value. The crosses on the indicator are for debugging purposes only. They mark the pivots that were recorded into the arrays. The crosses are offset by the pivot strength and do not provide timely indications. All inputs are adjustable for the pivots in the "Pivots" section of the input menu. The second method for the OB/OS lines I added is Bollinger Bands. The user can choose to put it around the Signal or MACD line. The final method added is simply using the previous high/low pivot of the MACD line.

Simple PivotsSuper Simple Pivots, based on
and adapted from
Will take a low or high point and compare left and right, if its the lowest or highest respectively, a line is drawn forward until another point meets the criteria
The lookback period will delay the formation of new pivots. In the original two indicators, the pivot lines would stop drawing. I have added a line extension from the most recent pivots forward to indicate whether the current market price exceeds or is within the recent pivot point ranges. If the market price is above or below the high or low pivots respectively, the line will become solid. Otherwise, the pivot extension lines will be dotted.
There is an option to place price labels below the historical pivot points. Default is disabled because it clutters the chart.
Removed all alerts and MA from the original two indicators to improve speed.
Let me know if you have any questions!
gkjch

Parallel Pivot Lines [LuxAlgo]Displays lines connecting past pivot high/low points with each line having the slope of a linear regression. This slope can also be controlled by the user with the 'Slope' setting. Each line can be used as a support or resistance by the user.
Settings
Length : Pivot length. Use higher values for having lines connected to more significant pivots points.
Lookback : Number of lines connecting a pivot high/low to display, with a total of lines equal to Lookback*2
Slope : Allows the user to multiply the linear regression slope by a number within -1 and 1
Limitations
The script has currently several real time behavior limitations. Lines are displayed retrospectively and will not update with the arrival of new bars. Readjusting the indicator to newer pivots will require the user to either hide/unhide the indicator or change its settings.
High Length or Lookback values might not return any lines if the location of a pivot point is outside the defined buffer size of the indicator (set as 5000 bars).
How To Use
The indicator can be used to get supports and resistances and is more so closer to a drawing tool due to its limitations. The lines not updating with the arrival of new bars have the advantage of providing fixed supports/resistances.
The Slope setting allows the user to control the angle and direction of the lines. Using a Slope of 1 will return lines with the same slope as the one of a linear regression fit from the farthest pivot point displayed by the indicator to the most recent bar.
The chart above shows the indicators and a linear regression in orange.
If you want to have horizontal lines, use a Slope equal to 0.
Finally using a negative slope value will allow the user to have lines in opposite directions to the main trend.
Conclusion
We hope you like this indicator (drawing tool) and find it useful for drawing your support & resistances in a unique way!
